Construction Market Trends
Fall 2025
A Shifting Construction Market
Steve Stouthamer
Executive Vice President, Project Planning
Skanska USA Building
Supply Chain
Industry Indices
Forecast
Webinar Series
Email Steve
Construction
Winter 2025
Supply Chain.
Escalation Forecast.
Industry Indices.
Indices
Webinar
Contact
Download Report
Market Trends Report
Escalation Forecasts
Our Strategic Supply Chain Team maintains relationships with manufacturers and is closely monitoring the impact of tariffs on the supply chain.
Tariffs
The commercial construction sector faces a mixed outlook over the next 12–18 months. The uncertainty of interest rates, evolving federal tariffs and broader economic policy shifts are causing developers, corporations and government entities to proceed cautiously with capital projects. Softer job numbers and a slight uptick in unemployment may signal a cooling economic environment, which could further temper construction activity. Compounding matters is the current federal government shutdown. Traditionally resilient construction sectors—like higher education and healthcare—have shown signs of slowing, contributing to a broader sense of market hesitation. Momentum in tech-driven sectors could provide key stabilizing opportunities amidst a cautious and uneven commercial construction market. Data centers continue to see strong demand, fueled by AI and cloud computing expansion. Similarly, semiconductor and pharmaceutical manufacturing are benefiting from federal incentives and reshoring trends, positioning them for robust investment in the near term. As a result of the positive outlook for these sectors, many general and trade contractors are pivoting their strategies to be better positioned to serve these markets, with a focus on meeting their speed-to-market needs.
While the U.S. engages with countries to work on improved trade agreements, the following tariffs remain in effect: The U.S., Mexico, Canada trade agreement (USMCA) from the first Trump administration remains in effect, exempting many products traded between the three countries, including many construction products, from further tariffs. In our March webinar, we projected that tariffs at the time could increase commercial construction project costs by +/- 5 percent. With early April’s tariff escalations, we felt that range could potentially double, but fortunately many of those higher tariff ranges have been paused to potentially allow for trade negotiations to continue. The cost of construction rose considerably post-pandemic, and additional tariffs would only challenge budgets further. These pressures could reduce construction spending, partially offsetting increased costs but also creating employment and recessionary concerns. As we monitor further tariff policy changes and shifts and reductions in federal investment spending, below are some potential risk mitigation strategies.
The USMCA is very important considering the volume of construction materials that pass between the three countries. We urge suppliers to continue to seek inclusion of products not currently covered by the agreement to mitigate tariff duties. Be flexible with the specification of construction materials for projects. It may be possible to onshore the same or comparable products that are not currently subject to tariffs. Monitor developments in tariffs and trade negotiations. As we do with our Strategic Supply Chain Team, go deeper into your supply chains to understand what manufacturers are doing to mitigate tariff risks. Partner with manufacturers who have been able to pivot and deliver in the most economical manner.
Contact us for more detailed, up-to-date information
Our Strategic Supply Chain team and our guests from Steel and Aluminum industries will be covering the impacts of tariffs on our upcoming Webinar. Register here
Next Page
Keep scrolling to read our full analysis on the impending impacts
How to prepare:
Analysis
Fall Market Trends Report published: November 10, 2025
25%
30%
10%
tariff on all steel and aluminum, as well as their derivative products
tariff on all Chinese imports (down from 145% based on 90 day pause as of 5/12/25)
universal tariff on all foreign imports
Current Tariffs Implemented by the U.S.
Total: 25%
Reciprocal
Current Tariffs Implemented by the U.S. Impacting the Construction Industry
The current administration has announced a blanket 10-percent tariff on all lumber imports, effective October 14. It is not expected to have a significant impact on lumber pricing. Earlier this year, Canadian lumber tariffs were increased to 35 percent. Canada accounts for more than 80 percent of imported lumber into the U.S. However, depressed demand from the housing market has prevented lumber pricing from moving upward in a significant way.
Copper pricing temporarily collapsed after surprise exemptions were included in the refined and scrap copper tariffs. These make up over 80 percent of annual copper imports. Copper price decreases were only temporary, as two key copper mines—which account for five percent of global copper supply—faced natural disaster-induced shutdowns, pushing copper supply into a deficit. Pricing is forecast to remain elevated this year, driven by strong demand. Pricing for copper pipe remains up nearly 40 percent on the year, and copper wire pricing is up.
Goods imported from Canada and Mexico may be eligible for tariff exemptions IF they are USMCA-compliant. However, the USMCA’s future is currently under a critical review process. The three member countries are expected to reach an agreement on the future of the USMCA sometime in 2026.
14.5%
tariff on all Canadian lumber
Canada
All Goods
Lumber
USMCA
35%
35.2%
—
China
30-47%*
Mexico
Materials
Steel
Aluminum
50%
Copper
Tariff rate depends on the type of product being imported.
Copper pricing temporarily collapsed after surprise exemptions were included in the refined and scrap copper tariffs. These make up over 80 percent of annual copper imports. Copper price decreases were only temporary, as two key copper mines—which account for five percent of global copper supply—faced natural disaster-induced shutdowns, pushing copper supply into a deficit. Pricing is forecast to remain elevated this year, driven by strong demand. Pricing for copper pipe remains up nearly 50 percent on the year, and copper wire pricing is up
Given the current uncertainties and labor shortages as well as new construction opportunities, please join us for Skanska’s Market Trends Webinar for innovative, adaptive strategies to build faster, safer and smarter.
Fall 2025 Supply Chain
Source: U.S. Energy Information Administration, October 2025
Source: Engineering News-Record, October 2025 U.S. Bureau of Labor and Statistics and Producer Price Index, Drywall and Gypsum, August 2025 *Due to the Government shutdown, data from the U.S. Bureau of Labor and Statistics is not current
Source: Steel Benchmarker, October 2025
Source: U.S. Bureau of Labor and Statistics Producer Price Index, August 2025 *Due to the Government shutdown, data from the U.S. Bureau of Labor and Statistics is not current
Source: Engineering News-Record, October 2025 U.S. Bureau of Labor and Statistics Producer Price Index, August 2025 *Due to the Government shutdown, data from the U.S. Bureau of Labor and Statistics is not current
Generators
HVAC Equipment
Electrical Gear
Fuels and Natural Gas
Piping
Structural Steel Inputs
Concrete and Cement
Gypsum and Metal Studs
Lumber and Wood
Metals
Status Key
Trending Up Significantly
Trending Up
Fluctuating
Trending Down
Stable/Consistent
Previous Page
- Overall, metals pricing is up from mid-year. - However, the rally caused by China’s stimulus program at the end of September proved to be short-lived, and pricing has since settled down.
Source: Kitco All data as of October 2024
Material
Ceilings, drywall, metal studs, flooring, paint, etc.
Current Status:
Lead Time
6-12 Month Forecast:
Price
Concrete prices have flattened after increases seen at the start of the year. Tariff impacts in this category are minor, as three-quarters of the cement used in the U.S. is produced domestically, and further weakened construction activity is helping concrete pricing remain flat.
Source: Engineering News-Record, October 2025 and U.S. Bureau of Labor and Statistics Producer Price Index, August 2025 *Due to the Government shutdown, data from the U.S. Bureau of Labor and Statistics is not current
No recent drywall price increases have been announced, and drywall pricing remains flat as demand has softened. In response to upward movement in the coiled steel market, major steel stud manufacturers have increased their prices starting November 3 by 10 percent.
10-percent tariffs on softwood lumber imports have been levied, effective October 14. Although markets are seeing a slight uptick in lumber pricing, significant escalation is not expected if housing starts remain weak.
Copper prices have stabilized after crashing from record highs in July. Aluminum prices continue to push record highs. Nickel prices are down and have stabilized. However, prices remain elevated as demand, particularly from construction sectors where significant copper products are utilized, such as Data Centers and other High Tech, remains high in these sectors.
Source: Kitco, October 2025
While crude oil prices have declined, unleaded fuel pricing remains relatively flat, and diesel pricing continues to trend up. This divergence is mostly attributable to geopolitical influence on the oil market. Renewable diesel fuel is also gaining popularity for its carbon reduction potential, expanding its supply chain availability and potentially impacting fuel pricing.
PVC: Soft residential demand continues to drive PVC pipe prices down. Copper Piping: Copper pipe prices have leveled off, but are still up 30–40 percent YTD. Carbon Steel: Carbon steel pipe prices remain stable despite increased steel tariffs.
Structural steel pricing continues to move slowly and steadily upward, including recent increases of $35/ton on wide flange steel and $60/ton on plate steel. As tariffs take hold, its likely we are seeing domestic mills inching pricing upward as importers become strained by tariffs. In addition, data center demand is straining mill capacity and increasing lead times to 14–18 weeks.
Structural Steel
Lead times for electrical gear are stable, largely as a result of manufacturer investment in factory expansions to increase production capacity. Lead times do remain elevated for switchgear, switchboards, ATS and liquid-filled, pad-mounted transformers. Lead times on specific equipment can vary greatly depending on the manufacturer. Prices in 2025 are up 8–10 percent YTD. However, price escalation will likely be 5–8 percent in 2026.
Source: FRED, August 2025 *Due to the Government shutdown, data from the U.S. Bureau of Labor and Statistics via FRED is not current
Demand for data center gensets (>2750MW) remains very strong. This, coupled with constraints in the genset enclosure market, is starting to increase lead times. Lead times for 1MW to 2MW gensets are between 34–52 weeks; 250kw to 1MW range from 30–35 weeks; below 350kW are stable at 18–30 weeks. Actual lead times vary depending on the manufacturer and specifications. Prices are up 10–15 percent in 2025 but escalation is expected to slow in 2026.
Lead times for HVAC equipment are trending down for most equipment categories. Price increases through 2025 are expected to be between 10–12 percent, depending on the manufacturer. However, lower demand and cost mitigation efforts are expected to slow price escalation in 2026.
Insulation
Insulation pricing remains flat due to softening demand. No price increases have been announced since the July mineral wool announcement.
Source: U.S. Bureau of Labor and Statistics, October 2025 *Due to the Government shutdown, data from the U.S. Bureau of Labor and Statistics is not current
Supply Chain Analysis
Like many that work in supply chains, we’ve learned a lot this year. The U.S. has not seen such wide-scale tariffs since the Smoot-Hawley tariffs were levied in 1930. Although economists broadly agree that tariffs are not good for the economy, early projections for the scale of tariff impacts varied widely. This uncertainty caused many of the commodities markets to overreact to new tariff declarations, especially at the start of the year when widespread tariffs were first announced. What we have seen since is a “settling in” of markets and market pricing. Despite significant tariff rates, price increases in most material categories have been minimal. There are many reasons for this, including manufacturer buy-ahead activity, re-sourcing of material to lower- or non-tariffed locations and dilution of tariff impacts across multiple parts of the supply chain. However, the primary force mitigating tariff impacts is demand. Demand for construction materials has been muted because of project delays caused by uncertainty and current interest rates (most significantly in residential construction). One exception is MEP trades and materials which continue to see high demand from the tech sector. This low-demand environment has limited the ability of suppliers to pass on price increases to the market. As a result, supply chains have absorbed many tariff costs, but in doing so have created a level of margin compression. As interest rates decline, demand will likely increase and supply chains will look to recoup the compressed margin given up during this low-demand period. How significant will the marketplace impact of this adjustment be? There’s still more to learn.
Greatest threats to supply chain stability:
HVAC equipment, electrical gear, steel, elevators and curtain wall will be impacted by the 10-percent tariff on all Chinese goods, as well as the 25-percent tariff on all imported aluminum and steel. Additional categories, such as finished goods, lumber, drywall, fixtures, and other material, may be affected by potential duties in March.
Immigration
Labor markets in the U.S. remain tight given the low unemployment rate. Slowing immigration and increased deportation of undocumented workers may exacerbate the construction and manufacturing labor markets.
Recent disasters, including Hurricane Helene in the Southeast and the wildfires in Southern California, will likely have significant impacts to their regional construction supply chain.
There remains uncertainty around the wars in Ukraine and the Middle East, as well as the potential for further conflict related to Taiwan and North Korea.
Our Strategic Supply Chain Team is closely monitoring the impact of weather related disasters and geopolitical events on the supply chain.
2MW+
What we’ve learned this year...so far
Drywall and Gypsum
Summer 2025 Supply Chain
Fall 2025 Indices
Materials and Commodities
Drywall, Gypsum and Insulation
Market Sentiment
Home
Pricing
Forecast Map
Contact Us
Construction Cost Indices
Spending
Building Cost Index
Materials Index
U.S. Employment
Labor
Architecture
Unemployment
Click an index or material to view details
Winter 2025 Construction Pricing Snapshot
The ENR Materials Index continues to cool from the significant year-over-year inflation experienced in 2021 and 2022. Like the BCI and CCI, the Materials Index doesn’t include mechanical and electrical equipment cost impacts, which have driven project costs higher than traditional measures of construction inflation. With the large volume of high-tech work and expanding electrification efforts in service of decarbonization, such equipment costs will remain high.
Source: Engineering News-Record Data as of November 2024
Use this slider to modify the timeframe of the data shown on the graph. Click on the graph for specific pricing data points.
Source: U.S. Bureau of Labor Statistics All data as of October 2024
Hover over the chart to see exact figures
The unemployment rate sits at 4.1 percent as of October 2024, down from a high of 4.3 in July 2024. Total nonfarm payroll employment experienced a slowdown in growth in October with only 12,000 additional jobs added. This is attributed to the decrease in manufacturing employment due to labor strikes and offsetting growth in healthcare jobs. Construction only had a minor increase of 8,000 jobs from September to October, keeping the unemployment rate steady.
U.S. Unemployment
For the past 12 months, both of ENR’s core construction indices have remained below the 3–3.5 percent historical, annualized escalation trend. However, it’s important to remember that regional locations are experiencing inflation differently based on work volume. MEP system costs, which are not incorporated in the ENR indices, continue to escalate more rapidly than other building systems.
Source: U.S. Census Bureau and Dodge Data & Analytics Construction spending data for September 2024 and Dodge Momentum data is from September 2024
While the Dodge Momentum Index decreased 4.2 percent from August to September, the index remains at “very robust levels,” up 21 percent from September 2023. In September 2024 alone, 28 projects valued at $100 million or more entered the planning stage. Per Sarah Martin, associate director of forecasting at Dodge Construction Network, “A surge in data center activity drove much of the recent rapid growth in the DMI...By mid-2025, the Fed’s rate cuts should spur planning projects to reach groundbreaking more quickly.”
Construction Spending and Dodge Momentum Index
Might Change
Source: Engineering News-Record All data as of November 2024
Skilled Labor Index and Common Labor Index
ENR's craft labor indices have had year-over-year increases under 1.8 percent. The 10-year average annual increases for these indices are in the 2–2.5 percent range. However, because they do not factor in mechanical and electrical (M/E) crafts, these indices can be misleading and may underestimate labor cost escalation. A similar 10-year trend for M/E labor has shown a 4.2 percent increase per year. Given the mix of trades on construction projects, we estimate that the annual craft labor increase for the past 12 months is in the 2.5–3 percent range.
Skilled Labor and Common Labor Indices
Source: AIA, All data as of September 2024
The Architecture Billings Index remains below 50, as the majority of firms continue to report a decline in billings. Conditions remain soft in all regions of the U.S., with firms in the South reporting the strongest ABI at 49.5. However, the pace of decline seems to have subsided, and conditions may turn positive soon given the lowering of interest rates by the Fed in September.
September ABI Report
Architecture Billings Index
This Architecture Billings Index (ABI) demonstrates whether or not architectural firms are billing for or signing new design contracts. The construction industry feels the impact of this index with a 9-to-12-month lag time.
Scoring
-50: decrease in volume =50: neutral 50+: increase in volume
The drop in prices over the past 60 days is driven in part by sluggish demand for gas as the busy summer traveling season has given way to an autumn slowdown. Meanwhile, a sharp decline in the price of crude oil has propelled a larger drop-off in gas prices than is typically seen at this time of year.
Source: U.S. Energy Information Administration All data as of October 2024
Source: Engineering News-Record and U.S. Bureau of Labor and Statistics data as of October 2024 and Producer Price Index data as of September 2024 Drywall and Insulation data as of October 2024, Gypsum data as of October 2024
Drywall availability and pricing are stable. Insulation prices are stable in the short term but an increase in new home sales could apply upward pressure. Lead times for mineral wool insulation remain elevated but have receded slightly from 30 weeks down to 20 weeks.
Source: Engineering News-Record and U.S. Bureau of Labor and Statistics Producer Price Index Concrete Block and Precast Concrete data as of September 2024 4000 PSI data as of September 2024
Concrete pricing continues to rise but at a slower pace than 2023. Quarter to quarter, 4000 PSI concrete pricing is up just 0.6 percent.
Source: Steel Benchmarker All data as of October 2024
Structural steel pricing fluctuates from week to week, but the overall trend since the start of 2024 has been downward. Plate steel, the most significant component in building structural steel, has been a key reason for lower fabricated steel pricing.
PVC: PVC pipe prices are down due to low residential demand and a solid supply of resin. Copper: Raw copper prices have been volatile. However, pipe costs have remained relatively flat since last quarter. Ductile Iron Pipe: Prices have been relatively stable over the last six months due to flat demand.
Source: U.S. Bureau of Labor and Statistics Producer Price Index All data as of September 2024
Lumber pricing continues to be soft due to weak demand. Housing starts remain low at 1.35 million for the month of September, down from 1.36 million in August.
Source: Engineering News-Record and U.S. Bureau of Labor and Statistics Producer Price Index Plywood and 2x4 S4S data as of October 2024 Lumber and Plywoo4d data as of October 2024
Overall, metals pricing is up from mid-year. However, the rally caused by China’s stimulus program at the end of September proved to be short-lived, and pricing has since settled down.
Dodge Starts and Momentum Index
Architectural Billings Index
Employment Rates
ENR Building and Construction Cost Indices
Composite Cost Index
Construction Spending
Index
The 12 months ending November 1 saw the CCI move up 3.4 percent and the BCI move up 3.9 percent. More significantly, both indices saw an increase of more than 1.3 percent for the quarter. While one quarter does not make a trend, tariff impacts are a likely reason for the indices to be advancing at a higher rate than has been seen in the past three years. It will be important to watch these indices over the next several months. It is worth noting that these indices do not include key MEP trades, which have had a higher trajectory given the investment in high-tech sectors.
Source: ENR, November 2025
MEP costs make up a significant portion of total construction costs. Using our Skanska MEP expertise, we have forecasted the pace of MEP price inflation and blended this with the ENR (architectural/structural trades) indices. Our MEP data shows an annual increase of approximately 5.1 percent in those key trades, creating a Composite Index increase of 4.4 percent for the 12 months ending in November. This increase is between 0.5 - 1 percent above the ENR indices for the same time period reflecting the impact of the MEP Costs. While each region will feel the pace of escalation differently given local volumes, our escalation forecasts for individual projects are likely more aligned with the Composite Index.
Source: Engineering News-Record and Skanska, November 2025
The ENR Materials Index ticked up 2 percent for the quarter. The index had dipped earlier in the year before flattening recently, and it’s likely the increase is beginning to reflect tariff impacts. Similar to the BCI/CCI, one quarter does not mean a trend, but as tariffs are expected to put upward pressure on material costs, it’s worth monitoring the index closely over the next several months. The ENR Materials Index does not include mechanical and electrical material, which has escalated at a more significant pace.
Source: Engineering News-Record, November 2025
Total construction starts were up 3.1 percent in September 2025 to a seasonally adjusted annual rate of $1.26 trillion, driven mainly by nonbuilding and slightly by residential construction. Year-to-date, the number of starts is up by 3.5 percent from last year. Nonresidential building starts declined by 6.2 percent in September, but are up 5.0 percent from last year. The Dodge Momentum Index grew 3.4 percent from August to September, driven by momentum in data centers, healthcare and public buildings. Activity slowed for warehouses, office buildings, hotels and education projects. Year-over-year, the index is up 60 percent. The institutional segment was up 75 percent, and the commercial segment—even without data centers—was up 44 percent from September 2024.
Source: Dodge Data & Analytics, September 2025
Due to the government shutdown, the last data point for construction spending is in July 2025, totaling $2,139 billion—2.8 percent lower than in July 2024. In the first seven months of 2025, construction spending trailed 2.2 percent below the same period for 2024. From June, private construction spending decreased by 0.2 percent, while residential construction increased by 0.1 percent and nonresidential construction decreased by 0.5 percent. Public construction increased by 0.3 percent and educational public construction decreased by 0.1 percent from June.
Source: U.S. Census Bureau, August 2025 *Due to the Government shutdown, data from the U.S. Bureau of Labor and Statistics is not current
The Architecture Billings Index is still in decline, with a score of 43.3 in September—the lowest reading since April—down from 47.2 in August. Design inquiries were flat in September, and the value of new design contracts declined for the nineteenth consecutive month. Firms in the West reported their weakest conditions for the fourth straight month, while firms in the Midwest fared better than the rest of the country, with conditions essentially remaining flat. The backlog averages 6.1 months, down from 6.5 months at the start of 2025, marking the lowest point since the third quarter of 2022.
Architectural Billing Index
Due to the government shutdown, the last data point for construction unemployment was a drop to 3.2 percent in August. The industry lost 7,000 jobs over the month, driven mainly by decreases in nonresidential construction. On a year-over-year basis, industry employment has grown by 58,000 jobs, an increase of only 0.7 percent. ABC Chief Economist Anirban Basu expressed concerns for the construction industry, which has recorded job losses for three consecutive months. The national unemployment rate rose to 4.3 percent in August 2025. The increase in jobless claims, low hire and quit rates, and narrowing job gains—only 22,000 jobs were added in August—is driving a climate of prudence.
Source: U.S. Bureau of Labor Statistics, August 2025 *Due to the Government shutdown, data from the U.S. Bureau of Labor and Statistics is not current
Employment
Dodge Momentum Index
Construction Starts Index
Composite Construction Cost Index
ENR Construction Cost Index
Winter 2025 Indices
Source: AIA, September 2025
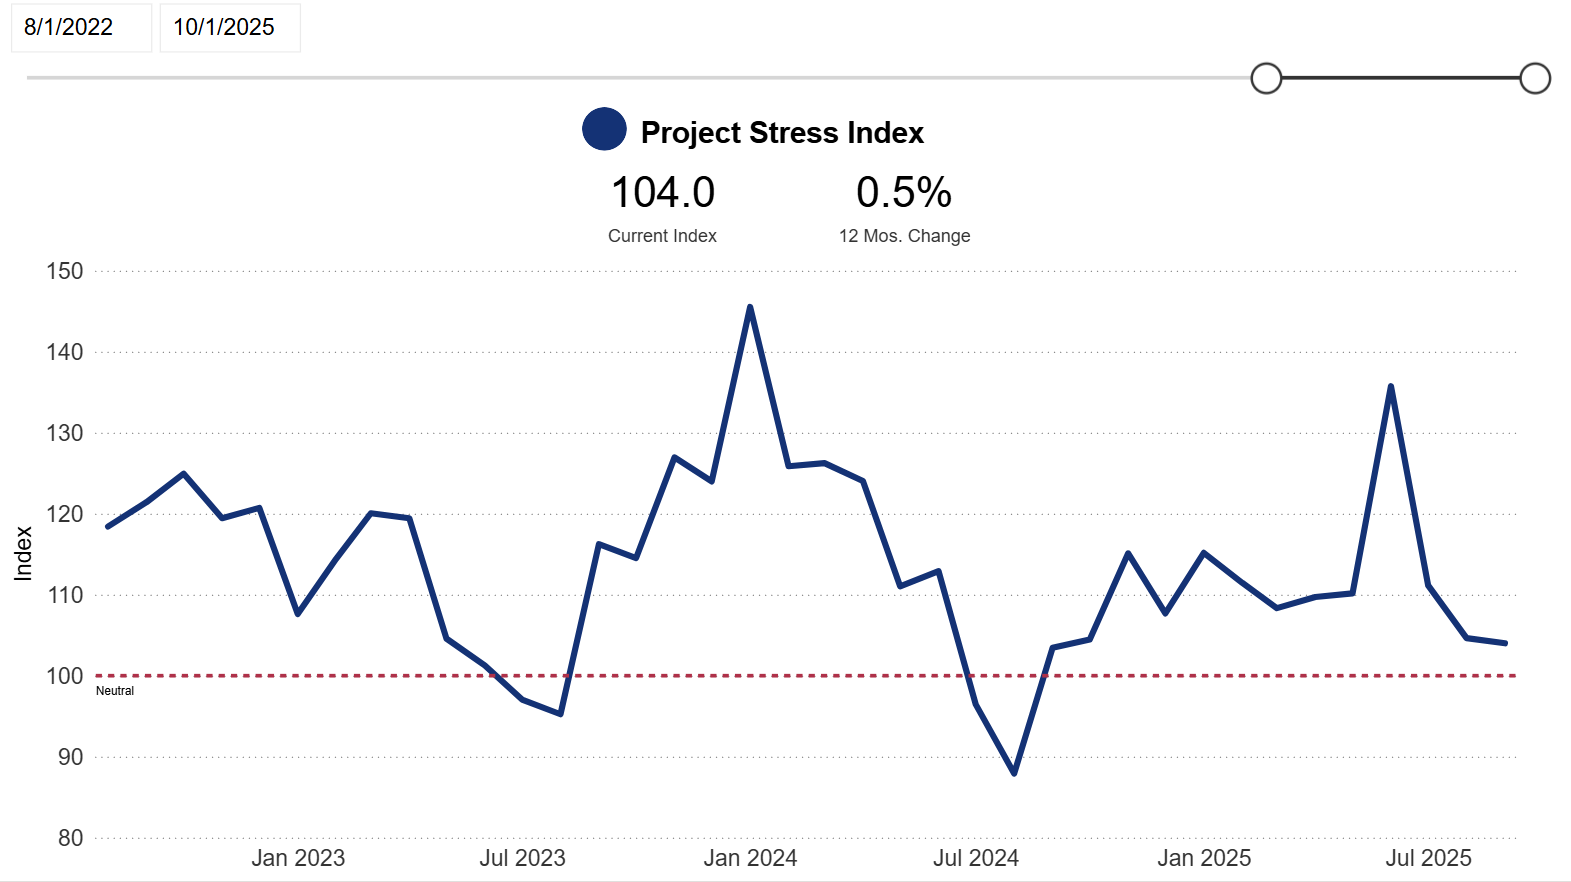
Project Stress Index
The Project Stress Index (PSI) tracks delayed bid dates, on-hold projects and abandonments in preconstruction over the past 30 days, providing an early warning system for market conditions. The PSI closed August 2025 at 104.6, marking a 5.9-percent month-over-month decrease from July’s reading—a yearly low. The overall PSI has risen 19 percent compared to last year, driven by an 88.2 percent increase in project abandonment activity. Conversely, both bid date delay and on-hold activity saw declines of 7.1 percent year-over-year. Private sector bid date delays fell to near historic lows while public delays remained near historic averages. Public on-hold activity remains near historic averages, while private on-hold activity continues trending downward towards historic averages.
Source: ConstructConnect, September 2025
Placeholder 'til chart is embedded.
Forecasting Local 2025 Construction Costs
This map reflects local USA Building Project Planning Services team leaders’ opinions of market volume and capacity and is not based on published analytics or third-party forecasts.
Click the map pins to see forecast details for a specific city or region.
Miami/Ft. Lauderdale
Seattle
Portland
Orlando
Tampa
New Jersey
New York
Boston
Phoenix
Philadelphia
Washington D.C.
North Carolina/ Virginia
Cincinnati
Atlanta
Nashville
Houston
Dallas
San Antonio
Los Angeles
San Francisco
Boston/New England
Changes to federal NIH funding are still impacting the local construction market. Local private universities have paused almost all new construction projects—focusing instead on deferred maintenance—and many are considering layoffs. The healthcare market is also affected; many healthcare institutions have ties to local universities and NIH funding. Recent leasing activity indicates the local office market is starting to show some signs of life, but Boston remains one of the nation's slowest return-to-office cities. Infrastructure and aviation projects are continuing to move through preconstruction and into new project starts. These markets, along with new residential, are the few sectors driving the local construction market. Recent changes in the federal government indicate potential shifts to the awarding criteria for these projects in the future. Although Boston has not historically had a large mission critical market, there are potential data center and battery energy storage system projects on the horizon.
Want to discuss the local market position and forecast? Connect with Matt Impastato, Vice President of Preconstruction, Boston.
Cooler Temps Bring a Cooler Market
Back to map
Atlanta, GA
Mission Critical and Technology Projects The rapid growth of high-tech and infrastructure projects is accelerating industry expansion. This trend is driving increased demand for skilled labor and specialized subcontractors. Higher Education and K–12 Construction This sector is expected to remain steady through 2026. Anticipated challenges include labor shortages, rising material costs, and the need for sustainable and flexible design. Infrastructure Spending Federal spending and regulatory policies currently support mission critical opportunities. Despite federal funding uncertainties, the overall trajectory points to increased construction activity. Commercial Real Estate The commercial real estate market is expected to be dynamic and cautiously optimistic. Vacancy rates remain high, but leasing activity is up. The new construction pipeline is historically low, which may help rebalance demand over time. Residential Construction The residential construction forecast suggests a moderate but resilient market, driven partly by regional growth. Interest rates and inventory levels continue to impact home prices, which are expected to rise 2–3 percent over the next year.
Mission Critical Opportunities Continue to Expand
Want to discuss the local market position and forecast? Connect with Dane Wooley, Preconstruction Director in Atlanta.
Cincinnati, OH
Although tariffs have not had a significant impact on bid costs in the region, there are other forces at work. The local market is very busy, and trade partners are becoming increasingly selective about the projects they pursue. We are starting to see limited competition, specifically in the MEP trades, which is driving bid costs higher. Projects in the region are well distributed across a number of market sectors, including education, hospitality, commercial, aviation and multifamily residential/mixed use.
The Local Construction Market Remains Strong Despite Tariff Concerns
Want to discuss the local market position and forecast? Connect with Jeff Smoker, Vice President of Preconstruction in Cincinnati.
Dallas, TX
Data Centers, Data Centers and More Data Centers
Want to discuss the local market position and forecast? Connect with Linh Le, Vice President of Preconstruction in Texas.
Washington, D.C.
High interest rates, decreased demand and federal policy impacts have caused Baltimore and D.C.’s historically robust commercial office and multifamily residential markets to slow over the last few years. Projects within these sectors that are currently in planning are expected to commence in 2–3 years. On the other hand, public works and K–12 projects are seeing some activity. While these projects have traditionally been awarded via lump sum bids, some owners are moving toward the CM-at-Risk delivery method. Higher education projects, despite federal policy challenges, still have plans underway for 2026 and beyond, particularly around Baltimore. In healthcare, most projects consist of smaller renovations. Data center construction remains very active in northern Virginia, straining electrical trade labor and causing material and equipment cost escalation. Additionally, the Metropolitan Washington Airports Authority is planning a 15-year, $9-billion expansion and modernization at both Dulles and Reagan National airports. Major pharmaceutical manufacturing investment is also expected in Virginia.
Office and Multifamily Remain Slow Amidst Growth in Infrastructure and High-Tech Sectors
Want to discuss the local market position and forecast? Connect with Tom Strawbridge, Preconstruction Director in Washington, D.C.
Houston, TX
Houston is rapidly positioning itself as a major life sciences and biotech hub, complementing its traditional strengths in the energy and healthcare markets. Key structural advantages—such as the large research ecosystem around the Texas Medical Center, favorable business climate, available land in the suburban growth corridors and increasing capital flows—are helping to catalyze the growth. At the same time, the region is attracting significant investment in biomanufacturing, research and development, and lab/office real estate.
Biotech Is Leading the Way
Traditionally, West Palm Beach has trailed behind Miami-Dade and Broward counties in both the pace and scale of development. However, post-COVID migration and subsequent capital inflows are reshaping that landscape. Palm Beach County has been experiencing a recent surge of large-scale projects, including the mixed-use $1-billion Nora District Revitalization, The Avenir in Palm Beach Gardens and The District in Boynton Beach. The healthcare, higher education and private K–12 sectors are growing as well. NYU Langone, Palm Beach Behavioral Health and Palm Beach Atlantic University are planning expansion projects, and Vanderbilt University recently unveiled plans for a new West Palm Beach campus.
Is Palm Beach County Catching Up to Broward and Miami-Dade Counties?
Nashville, TN
Trades that rely heavily on tariff-impacted metals, including aluminum, copper and steel, are largely driving regional construction cost escalation. Despite these pressures, most trade subcontractors still report high available capacity, which has led to more competitive pricing. This heightened competition may be causing subcontractors to absorb some tariff impacts. However, the cost escalation in metal-reliant trades—often exceeding 10 percent of prior estimates—still surpasses the savings achieved in other trades, ultimately leading to increased total project costs. The hotel development market—one of the most robust in the country—remains strong, driven largely by Nashville’s thriving tourism industry. In contrast, residential development has slowed due to a market surplus and waning demand. Meanwhile, project development in Nashville’s East Bank district continues to progress and is expected to support construction activity across both the public and private sectors for years to come.
Material-Driven Cost Pressures and Evolving Construction Trends in Nashville
Want to discuss the local market position and forecast? Connect with Adam Hicks, Vice President of Preconstruction in Nashville.
North Carolina/Virginia
The regional market remains steady, and most projects are progressing as planned. The healthcare sector maintains its strong momentum, with many large projects seeking funding. Higher education faces setbacks due to federal funding restrictions, while the pharmaceutical and manufacturing sectors show a varied outlook. Data center construction in Virginia is advancing steadily, and additional activity in North Carolina is expected to increase pressure on the local labor market. Subcontractors remain busy—supported by a healthy pipeline of upcoming opportunities—but are actively pursuing new projects. Recent bid outcomes indicate strong subcontractor engagement and minimal tariff impacts. However, our region will continue to closely monitor tariff effects and labor trends.
Region Stays Busy in Key Sectors
Want to discuss the local market position and forecast? Connect with Chris Littlefield, Vice President of Preconstruction in North Carolina and Virginia.
Construction in New Jersey is facing delays and rising costs due to tariffs, immigration policies and regulatory changes. These challenges threaten investment and strain construction capacity in both public and private sectors. Industrial, office and commercial construction activity has slowed, marked by declining leasing activity, high office vacancies and reduced construction employment. However, the public infrastructure, utilities, healthcare, education and multifamily housing sectors show growth potential. Government investment is fueling major civil and utility projects, while hospitals, schools and mixed-use developments expand. Notable project advancements include Robert Wood Johnson University Hospital’s 229,000-SF ambulatory pavilion; NJIT’s 16-story, 453-bed residence hall; a 230,000-SF clinical facility for University Hospital and Rutgers; the HELIX innovation campus; and Rutgers’ $400-million campus upgrades.
Fall Forward: New Jersey Construction Grows Amid Rising Costs
Want to discuss the local market position and forecast? Connect with Nick Culver, Vice President of Preconstruction in New Jersey.
New York, NY
The New York construction market in 2025 underwent notable shifts driven by residential development and sustainability efforts. Although substantial investment in infrastructure and government projects is expected in 2026, tariff-related volatility continues to drive cost increases and project uncertainties. Private higher education institutions face funding challenges, so they are investing less in new projects and instead focusing on renovations and infrastructure upgrades. The healthcare and life sciences sectors, also navigating barriers to funding, have similarly slowed down. Green building is no longer a niche, but is becoming the norm. Developers are leaning into sustainability, retrofitting existing spaces to align with NYC’s ambitious climate goals. High-impact projects in the region include a $37-billion capital plan for JFK and LaGuardia Airport upgrades; the $8-billion Gateway Program, targeting critical rail improvements in the Northeast Corridor; and expansions to White Plains Hospital and South Brooklyn Hospital.
NYC Faces Challenges Amid Major Infrastructure Investments and Market Shifts
Want to discuss the local market position and forecast? Connect with Pratod Padalkar, Vice President of Preconstruction in New York.
Orlando, FL
There are multiple projects opportunities available in the Orlando market. A large development near downtown Orlando that has been in planning for the past several years has finally begun, and several smaller projects are also underway. While many of our trade partners have a comfortable backlog through the end of the year, they are eager to begin securing more work for 2026.
Eager for What's Next….
Philadelphia, PA
The Philadelphia construction market remains robust, with many promising opportunities being presented despite cost escalation and tariff impacts. Preconstruction activity is increasing, and there’s a generally positive outlook for the region. The science and technology sectors are especially strong, driven by a need for research and manufacturing space. Although the region’s mission critical sector has been historically slow, several data center projects on the horizon could revitalize the market. We’ve seen an uptick in RFPs as customers look to take advantage of a more competitive construction environment. Healthcare remains a steady sector, with projects ranging from small renovations to MEP infrastructure upgrades and even including several high-profile projects in their early planning stages. Higher education is in a slow period, having been more negatively affected by tariffs, rising material costs and reduced government funding. However, some projects are still moving forward with preconstruction efforts and feasibility studies.
Philadelphia Construction Market Steadies Amid Rising Costs
Want to discuss the local market position and forecast? Connect with James Lane, Vice President of Preconstruction in Philadelphia.
Phoenix, AZ
The overall data center market remains strong, although many of the key subcontractors are facing more competition in the market. We are still seeing increased prices despite having more bidders on local projects. The Taiwan Semiconductor Manufacturing Company and all of the supporting facilities are under construction and progressing at a rapid pace. Overall, the local market is strong.
Data centers and high tech manufacturing are still steady and strong
Want to discuss the local market position and forecast? Connect with Steve Clem, Senior Vice President of Preconstruction in Phoenix.
Portland, OR
The Portland Metro construction market continues to show signs of slowing, with increasing competition among general contractors and subcontractors. RFPs remain steady as owners look to take advantage of the competitive market. Many firms are now pursuing opportunities outside the Portland area—and even in other states—leading to new joint ventures and partnerships designed to support out-of-market success. The market continues to feature a mix of public and private projects. K–12 work remains steady, with large modernization projects moving forward and new bond proposals appearing on local ballots. The healthcare sector is strong, supported by new construction, facility upgrades and long-range master planning. Private investments and charitable donations are accelerating the design and construction of several healthcare campus master plans. Local municipal projects are also ramping up, with a growing emphasis on maintenance, sustainability and renewable energy. Meanwhile, manufacturing, distribution and warehouse developments continue to emerge, driven by a strong focus on speed-to-market. The local high-tech and mission critical sectors are slowing as investment shifts to other regions.
Amidst Some Uncertainty, Owners See Opportunities
Want to discuss the local market position and forecast? Connect with Matt Richardson, Vice President of Preconstruction in Portland.
San Antonio, TX
We continue to see strong momentum in mission critical development. This is particularly true in rural areas, where infrastructure limitations are prompting exploration of alternative energy solutions or substantial utility investments. Given the robust pipeline in this sector, proactive management of the skilled labor force remains essential. Because of the large military presence in the region, San Antonio is especially susceptible to the potential impacts of the government shutdown on capital projects, including the recently announced $750-million U.S. Department of Agriculture (USDA) domestic sterile fly production facility. Healthcare investment remains active, with local commitments from Baptist Health and HCA. Notably, CHRISTUS announced plans this summer to transfer ownership of its medical center campus to University Health, who is currently also undertaking a $1.5-billion expansion across multiple facilities in Bexar County. Overall, the region maintains a stable outlook with a steady flow of opportunities. Subcontractors generally report sufficient capacity and availability, contributing to favorable bidding conditions and broader coverage. However, pricing continues to trend upward, particularly in the mechanical and electrical trades.
Powering Progress: Mission Critical Expansion Continues
Want to discuss the local market position and forecast? Connect with Chris Hillyer, Senior Vice President of Preconstruction in San Antonio.
San Francisco, CA
The market conditions have tightened considerably as traditional sectors such as life sciences and tech have experienced significant reductions in headcount and their focus has shifted to deferred maintenance projects in lieu of large new builds. Healthcare development in the region remains busy in an attempt to meet patient demand and comply with the 2030 California Department of Health Care Access and Information (HCAI) structural performance standards, which many believe will be extended past 2030. Aviation is still strong, but many of the major projects are underway so future opportunities will likely diminish in the years ahead. Public Works and Education Projects continue to be available and are drawing more competition helping client budget targets.
Private work has cooled off, but Healthcare and publicly funded projects are moving forward
Seattle, WA
Seattle’s project opportunities still vary across market sectors. Private projects remain slow due to borrowing costs, tariff impacts and vacancy rates, while public projects—which are keeping the Seattle market afloat—are receiving funding to address population growth and aging infrastructure. Labor and material costs and lead times continue to climb due to strong market sectors like mission critical. With limited bidding opportunities, the market remains competitive. K–12 and higher education remain strong, with state funding and recently passed bonds supporting energy upgrades at local universities and colleges. The transportation market continues to expand. Sound Transit is moving ahead with plans to transition to electrified transportation and buildings, along with a planned expansion to the light rail system. Similarly, the Port of Seattle has a 5–10-year backlog of projects at the airport and their shipping ports. King County continues to receive project funding to upgrade aging infrastructure and accommodate future growth. The healthcare and manufacturing markets remain slow, as most projects in these sectors are confined to maintenance or upgrades to existing facilities.
The Public Market Sectors Keep Seattle Moving
Want to discuss the local market position and forecast? Connect with Dan Curtiss, Vice President of Preconstruction in Seattle.
Tampa, FL
Concerns remain in the region around tariffs, immigration and other federal policies. The potential for changes to immigration policy could reduce the labor pool, increasing demand and labor costs, and tariffs continue to create uncertainty. However, none of these concerns have yet materialized in increased project costs. Despite this, our trade partners have reserved their right to increase costs if they become impacted by tariffs. Single and multifamily housing construction demand hasn’t lessened and continues to put pressure on an already strained skilled labor market. Supply chains, costs and lead times have stabilized. We continue to see an increase in trade partners willing to bid, especially on healthcare, K–12 and higher education projects. This is a positive sign, indicating ongoing market activity. While we seek new opportunities in other sectors, we continue to see a steady release of government projects.
Trade Partner Participation Increases and Skilled Labor Shortage Continues
Want to discuss the local market position and forecast? Connect with Jeff Courtney, Preconstruction Manager in Tampa.
Design Sentiment
Don’t miss the new design sentiment section to see what our leaders had to say about the industry’s top concerns.
Want to discuss the local market position and forecast? Connect with Tom Stickrod, Vice President of Preconstruction in Orlando.
Want to discuss the local market position and forecast? Connect with Walt Chislak, Preconstruction Manager in South Florida.
See a summary of our market sector performance and local escalation forecast below.
Market Sector Overview
Local Escalation Forecast
Market is experiencing and/or is expected to experience significant/ abnormal construction price inflation (+6% per annum)
Market is busy and construction price inflation is/is expected to be above normal (between 4 and 6% per annum)
Market is stable and construction pricing / inflation is within traditional indices (less than 4% per annum)
Market is recessed and construction pricing / inflation is flat or negative
Market Sector is very busy with numerous large active projects either in Preconstruction or Construction
Market Sector is stable with some large active projects either in Preconstruction or Construction
Market Sector is slow with few large active projects either in Preconstruction or Construction
Skanska is not tracking this sector closely enough in our regional market to comment
Key
Market sector summary
Local escalation summary
Local Construction Cost Forecast
Next 6 months
6 months - 1 year
1 - 2 years
+6% per annum
4-6% per annum
<4% per annum
Market is recessed
Want to discuss the local market position and forecast? Connect with Steve Clem, Senior Vice President of Preconstruction in San Francisco.
Manufacturing
Transportation
Science + Technology
Aviation
Corporate Commerical
Data Centers
Distribution/ Warehouse
Healthcare
Higher Education
K-12 Education
The Dallas-Fort Worth (DFW) metroplex has rapidly become one of the nation's most active data center construction markets, with billions in funding being committed over the next several years. This surge is a product of sustained digital infrastructure demand, abundant land supply and strong grid connectivity across DFW. With major players like DataBank, AWS, Google, Compass, QTS and Stream accelerating their investment in AI and cloud infrastructure, an already strained local subcontractor market faces further pressure, especially the electrical and mechanical trades.
This Construction Market Trends report is developed by Skanska USA Building’s Project Planning, Strategic Supply Chain and Strategy teams. We publish the report quarterly, each February, May, August and November, with an accompanying Market Trends webinar. Historical quarterly reports can be found below. Sign up to be notified of the webinar and report release here.
Download now
Download the full Skanska USA Building Fall 2025 Construction Market Trends Report
Previous Reports
Q4 2020 Report
Q1 2021 Report
Q2 2021 Report
Q3 2021 Report
Q4 2021 Report
Spring 2022 Report
Summer 2022 Report
Connect with us
Click below for a previously published Skanska USA Building Construction Market Trends Report.
Back to contact
Fall 2022 Report
Executive VP of Project Planning
Preconstruction Coordinator
Vice President of Strategic Supply Chain
Director of Strategic Supply Chain
Senior Director, Business Planning and Strategy
Tom Park
Rob Cantando
Katie Wilson
David Formichella
Kez Gneiting
National Supply Chain Manager
Please contact us if you have questions, comments or want to discuss any of the content in this report.
Winter 2023 Report
Spring 2023 Report
Summer 2023 Report
Fall 2023 Report
Winter 2024 Report
Spring 2024 Report
Summer 2024 Report
Fall 2024 Report
Winter 2025 Report
Spring 2025 Report
Summer 2025 Report