Spring 2026 Supply Chain
Source: U.S. Energy Information Administration, April 2026
Source: Engineering News-Record, April 2026
U.S. Bureau of Labor and Statistics and Producer Price Index, Drywall and Gypsum, March 2026
Source: Steel Benchmarker, April 2026
Source: U.S. Bureau of Labor and Statistics Producer Price Index, April 2026
Source: Engineering News-Record, April 2026
U.S. Bureau of Labor and Statistics Producer Price Index, March 2026
Generators
HVAC Equipment

Electrical Gear

Fuels and Natural Gas
Piping
Structural Steel Inputs
Concrete and Cement


Gypsum and Metal Studs
Lumber and Wood

Metals


Status Key
Trending Up Significantly

Trending Up
Fluctuating

Trending Down
Stable/Consistent
Next Page
Previous Page


- Overall, metals pricing is up from mid-year.
- However, the rally caused by China’s stimulus program at the end of September proved to be short-lived, and pricing has since settled down.
Source: Kitco
All data as of October 2024
Material
Ceilings, drywall, metal studs, flooring, paint, etc.
Current Status:
Lead Time
6-12 Month Forecast:
Price
Concrete pricing continues to rise modestly, with expectations of a 3-4 percent increase this year. Rising costs for energy, transportation and raw materials like cement, gypsum and limestone are the main drivers.
Source: Engineering News-Record, March 2026 and
U.S. Bureau of Labor and Statistics Producer Price Index, March 2026
Concrete and Cement
Ceilings, drywall, metal studs, flooring, paint, etc.
Current Status:
Lead Time
6-12 Month Forecast:
Price
As of April, just one manufacturer announced a drywall increase, though there are doubts that this increase will be accepted by the market. Residential construction demand remains muted. In response to continued upward movement in the coiled steel market, major steel stud manufacturers have announced price increases in March and May.
Gypsum and Metal Studs
Ceilings, drywall, metal studs, flooring, paint, etc.
Current Status:
Lead Time
6-12 Month Forecast:
Price
After small, optimistic upticks in lumber pricing in anticipation of the spring selling season for housing, pricing has dropped again. Single-family housing starts are down by 14.2 percent, and permits have dropped by 5.4 percent.
Lumber and Wood
Ceilings, drywall, metal studs, flooring, paint, etc.
Current Status:
Lead Time
6-12 Month Forecast:
Price
Metals pricing continues to rise in nearly all categories, due to electrification, AI and the closing of the Strait of Hormuz—which has particularly affected aluminum. In addition, the revision of the Section 232 tariffs will have an increased impact on metal-intensive products and derivatives.
Source: Kitco, April 2026
Metals
Ceilings, drywall, metal studs, flooring, paint, etc.
Current Status:
Lead Time
6-12 Month Forecast:
Price
Since the onset of the Iran conflict, oil prices have risen steeply, driving unleaded fuel costs up by more than 45 percent and 56 percent for diesel since January. This spike impacts shipping and equipment operation costs, as well as the cost of products with a petrochemical composition. In addition, some manufacturers are issuing surchargest to support their increased shipping costs. Fortunately, while prices have been impacted, we have not seen any effects on supply.
Fuels and Natural Gas
Ceilings, drywall, metal studs, flooring, paint, etc.
Current Status:
Lead Time
6-12 Month Forecast:
Price
PVC: While indices are still catching up, the war with Iran and blockade of the Strait of Hormuz is impacting 20 percent of global oil supply, driving up PVC resin costs and pipe prices.
�Copper Piping: Copper hit an all-time high in January, continuing to push copper pipe prices up.
�Carbon Steel: Carbon steel pipe prices are rising again as demand and raw steel costs increase.�
Piping
Ceilings, drywall, metal studs, flooring, paint, etc.
Current Status:
Lead Time
6-12 Month Forecast:
Price
Structural steel price increases continue to grow, with strong demand from data centers and large factory projects. Mills are focused on increasing utilization and are stretching rolling intervals to 10–12 weeks. Large fabricators are also very busy, pushing overall lead times to 40-45 weeks (typical lead times since 2020 have been 15-20 weeks).
Structural Steel
Ceilings, drywall, metal studs, flooring, paint, etc.
Current Status:
Lead Time
6-12 Month Forecast:
Price
Lead times for electrical gear are trending up again due to increased demand filling the capacity of North American factories. Manufacturers have invested in factory expansions and outsourcing; however, demand is outpacing output increases. Lead times for switchgear and pad-mounted, liquid-filled transformers are the longest at 60–100 weeks. Prices in 2026 are expected to rise 8–10 percent higher due to strong demand, tariffs and metal price increases.
Source: FRED, March 2026
Electrical Gear
Ceilings, drywall, metal studs, flooring, paint, etc.
Current Status:
Lead Time
6-12 Month Forecast:
Price
Demand for data center gensets is affecting units 2MW and above, as demand for larger gensets has filled capacity for the next two to three years. Lead times are 30–35 weeks for 250kw to 1MW and 18–30 weeks for below 350kW, though they vary depending on the manufacturer and specifications. Prices in 2026 are expected to increase 5–8 percent.
Source: FRED, March 2026
Generators
Ceilings, drywall, metal studs, flooring, paint, etc.
Current Status:
Lead Time
6-12 Month Forecast:
Price
Lead times for HVAC equipment are stable and are increasing for some manufacturers and products due to strong demand from data center and semiconductor clients. In light of the expanded Section 232 tariffs for derivative products, we adjusted the 2026 price increase forecast from 8–10 percent to 10–12 percent, depending on the manufacturer.
Source: FRED, March 2026
HVAC Equipment
Ceilings, drywall, metal studs, flooring, paint, etc.
Current Status:
Lead Time
6-12 Month Forecast:
Price
Insulation

Insulation pricing continues to be stable, with the exception of polyiso insulation board, which is heavily dependent on petroleum pricing. Major manufacturers in this market have announced 6-12 percent increases, effective in the April/May timeframe.
Insulation
Ceilings, drywall, metal studs, flooring, paint, etc.
Current Status:
Lead Time
6-12 Month Forecast:
Price
Source: U.S. Bureau of Labor and Statistics, April 2026

Supply Chain Analysis
The answer, in a word, is metals. Metals pricing is experiencing inflation in nearly every category. The combination of tariffs, constrained supply and increasing demand is driving prices higher. Here are some examples of what we are seeing:
Steel
HRC/CRC prices continueing to rise and areis up nearly 45 percent% since mid-2025. This is driving up the cost of metal studs. Major stud manufacturers have announced increases of 10–15 percent, effective in January, in addition to previous increases that were implemented in November. In addition, structural steel pricing is also on the rise. Wide flange pricing is up $100/ton from October 2025. The combination of tariffs and strong demand from data centers and manufacturing facilities are key factors driving up prices.
Copper
Futures are trading at an all-time high, topping out above $6/lb. in early January. Pricing has retreated slightly as global inventories have risen, especially in China. However, demand remains strong as the shift towards electrification, renewable energy and artificial intelligence continues. Copper wire pricing is up 25–30 percent from January 2025.
Aluminum
Tariff impacts have been more pronounced in this category, due partly to the fact that the U.S. produces less aluminum than other metals. While nearly 80 percent of steel utilized in the U.S. is produced domestically, less than 50 percent of aluminum is. The Midwest Premium has grown from $500/tonne to $2,200/tonne, which led several curtain wall manufacturers to announce price increases in 2025 and then again at the start of 2026. In addition, aluminum wire pricing is up nearly 20 percent.
Further inflation of metals pricing will depend heavily on domestic and international demand. China is a major consumer of metals and is currently experiencing a significant downturn in their real estate market, which has so far prevented higher levels of inflation. Should economic activity pick up, we expect to see even more inflationary pressure in the metals markets. Speculative buying of some metals (gold, silver and copper) has also surged in early 2026, further driving metals pricing inflation.
Supply Chain Analysis
Greatest threats to supply chain stability:
Tariffs
HVAC equipment, electrical gear, steel, elevators and curtain wall will be impacted by the 10-percent tariff on all Chinese goods, as well as the 25-percent tariff on all imported aluminum and steel. Additional categories, such as finished goods, lumber, drywall, fixtures, and other material, may be affected by potential duties in March.
Immigration
Labor markets in the U.S. remain tight given the low unemployment rate. Slowing immigration and increased deportation of undocumented workers may exacerbate the construction and manufacturing labor markets.
Recent disasters, including Hurricane Helene in the Southeast and the wildfires in Southern California, will likely have significant impacts to their regional construction supply chain.
There remains uncertainty around the wars in Ukraine and the Middle East, as well as the potential for further conflict related to Taiwan and North Korea.


Contact us for more detailed, up-to-date information
Our Strategic Supply Chain Team is closely monitoring the impact of weather related disasters and geopolitical events on the supply chain.

2MW+
2MW+
Supply chains challenges are in the spotlight again
Supply Chain
Analysis
Indices
Forecast
Contact
Download Report
Register for Webinar

Crude Oil
Unleaded Fuel
Diesel
Natural Gas
Current Price

The war in Iran and closure of the Strait of Hormuz are wreaking havoc on the petroleum market. Global oil prices have increased by more than 40 percent, with Brent Crude topping $119/barrel at times. Roughly 20 percent of the world’s oil travels through the strait; however, this has slowed to a trickle.
�Immediate impacts on the construction industry revolve around the price of diesel fuel, which has risen more than 40 percent and topped out at over $5/gallon. This drives up the cost of operating heavy equipment and power generation equipment, as well as the travel of trade partners and transportation of equipment and materials to and from jobsites.
�We are also starting to see elevated costs working their way through supply chains, with several petroleum-based product categories implementing price increases. For example, major roofing material manufacturers have announced increases in the range of 5-8 percent. Manufacturers of polyiso insulation, which is also heavily dependent on petroleum, have announced increases up to 10 percent. PVC and polypropylene resins have experienced over 50 percent price escalation, and those costs are now rippling through to finished piping goods.
�The war is also hurting the aluminum market. Iran attacked two aluminum smelting operations in the Middle East—one in Bahrain and the other in Abu Dhabi. Each of these facilities typically produces over 1.6 million tons a year, accounting for 5-6 percent of global supply, and up to 9 percent of the global supply travels through the strait. These disruptions are further escalating the price of aluminum, which has already experienced steep uptick because of tariffs. Aluminum pricing on the London Metal Exchange hit a four-year high of $3,650/ton in April.
�Nobody can say for certain how the rest of this geopolitical crisis will play out, but we do know that the supply chain will remain volatile.�
Supply Chain
Analysis
Indices
Forecast
Webinar
Contact
Register for Webinar
Drywall
Metal Studs
Current Price
Crude Oil
Unleaded Fuel
Diesel
Natural Gas
Forecast Price
Drywall
Metal Studs
Forecast Price
Hover for More
Spring 2026 Indices

Dodge Starts and Momentum Index
Architectural Billings Index
Employment Rates
ENR Building and Construction
Cost Indices
Composite Cost Index
Materials Index
Construction Spending
Next Page
Previous Page


The 12 months ending May 1 saw the CCI move up 2.4 percent and the BCI move up 3.3 percent. Both indices are up in comparison to the previous 12 months but, despite tariff impacts, are consistent with historical annual increases. Neither index reflects mechanical or electrical labor or materials, which play a significant role in overall construction pricing levels.
Source: ENR, May 2026
ENR Building and Construction Cost Indices
MEP costs make up a significant portion of total construction costs. Using our in-house Skanska MEP expertise, we have forecasted the pace of MEP price inflation and blended this with the ENR (architectural/structural trades) indices.
Our MEP data shows an annual increase of approximately 11 percent in those key trades, creating a Composite Index increase of 6.6 percent for the 12 months ending on May 1. MEP trade pricing has become very opportunistic, significantly impacting regions with data center and life science projects. Regions with less of this tech growth are seeing more stable MEP trade pricing. �
Source: Engineering News-Record and Skanska, May 2026
Composite Cost Index
The ENR Materials Index is up 5.3 percent for the 12-month period ending May 2026, a notable change compared to the same time frame the prior year, where the index increased just 0.1 percent. The steady climb over the past three quarters is driven in part by tariffs and other inflationary pressures, with recent escalation being attributed to the Iran conflict. While both the IEPPA tariffs and 10-percent global tariff have since been ruled illegal, the Trump Administration did declare specific tariff rates on products whose derivatives are made from imported metals to clarify the Section 232 tariffs. This action will continue to put upward pressure on material costs.
Source: Engineering News-Record, May 2026
Materials Index
Total construction starts were up 12.8 percent in March 2026 to a seasonally adjusted annual rate of $1.22 trillion, driven mainly by a 37.9-percent jump in nonbuilding construction. Nonresidential building starts were also up by 6.3 percent, driven by increases in manufacturing and hotels, but with declines in the commercial, warehouse and institutional segments. Across the 12 months ending in March 2026, total construction starts were up 5.4 percent from the same period last year.
The Dodge Momentum Index grew 6.2 percent from March to April, driven by an 8.1-percent increase in commercial planning and a 1.5-percent increase in institutional planning. Data centers continue to bolster overall commercial planning, but other commercial sectors also saw acceleration in April after months of slowing. Year over year, the Dodge Momentum Index was up 14.1 percent, with institutional planning up 28.8 percent and commercial planning up 37.2 percent, though that drops to only 5.8 percent when excluding data centers.
*Note: DMI data in this report reflects point-in-time values captured from original monthly releases. Dodge Construction Network periodically revises historical data, which may result in differences versus currently published figures.�
Source: Dodge Data & Analytics, March 2026
Dodge Starts and Momentum Index
Total construction spending in March 2026 totaled $2,186 billion—1.6 percent higher than March 2025. However, across the first three months of the year, total construction spending was just 0.3 percent above the same time period last year. Total residential construction increased 3.5 percent and total nonresidential construction remained relatively flat with a 0.2 percent increase. Spending increased across public and private sectors by 3.6 and 1.0 percent, respectively.
Source: U.S. Census Bureau, May 2026
Construction Spending
The Architecture Billings Index is still in decline, with a score of 49.8 in March (a score below 50 indicates declining firm billings), yet this is the closest that the ABI score has been to 50 since the first quarter of 2023. Inquiries into new projects increased in March, and backlog rose to an average of 6.6 months, the highest level since December 2023. However, the value of newly signed design contracts decreased for the twenty-fifth consecutive month.
Firms in the West reported a modest increase in billings, with a score of 50.6. All other regions remain soft, particularly the Northeast which holds a score of 44.2. All sectors were above 50, with the strongest gains in institutional (52.6) and commercial/industrial (52.5).�
Architectural Billing Index
In April, the construction industry added 9,000 net jobs, with 19,000 new positions in nonresidential construction. On a year-over-year basis, industry employment has expanded by 50,000 jobs, an increase of 0.6 percent. ABC Chief Economist Anirban Basu noted: "Nonresidential construction employment rose at a healthy pace for the month and is up a respectable 2.0% over the past year. This strength can be traced to surging data center construction spending, which is up 34% over the past year."
Nationally, the labor market outperformed expectations, adding 115,000 jobs in April and maintaining a steady unemployment rate of 4.3 percent. The labor market appears to be improving and stable after months of slower hiring and net job losses. However, the lagging oil price implications from the conflict in Iran may temper the labor market in the future.�
Source: U.S. Bureau of Labor Statistics, May 2026
U.S. Employment
Source: AIA, March 2026
March ABI Report

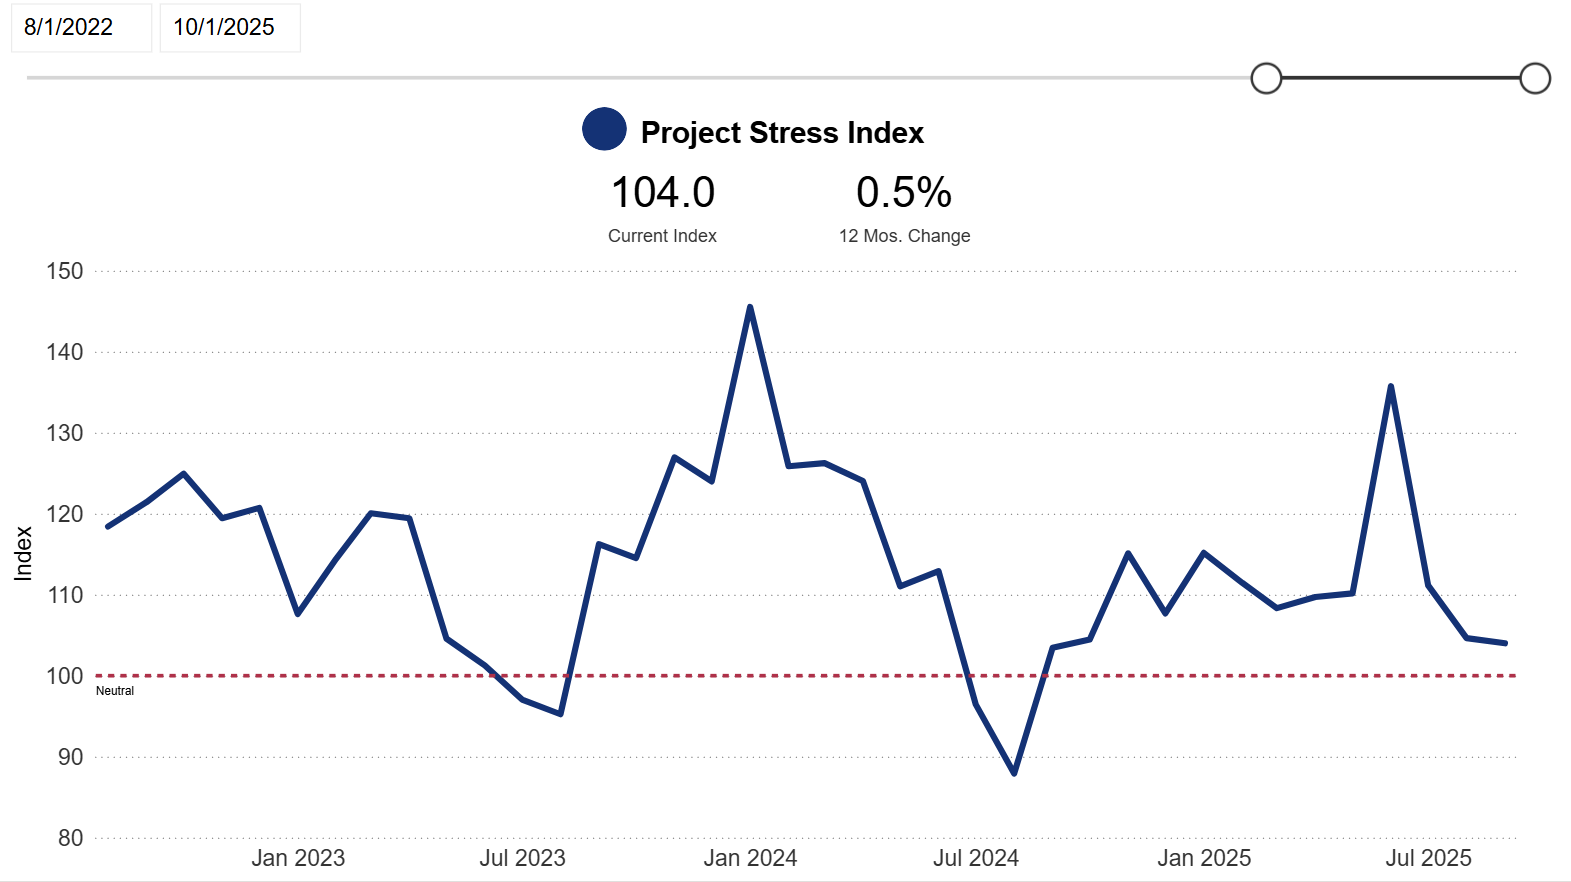
Project Stress Index
Unfortunately, the Project Stress Index (PSI) is trending upward, driven by a rise in project abandonment in preconstruction, with a reading of 104.6 in March and a 4.2-percent month-over-month increase from February. However, the March PSI is well below recent spikes in November 2025 (125.5) and June 2025 (135.7). The March PSI has also fallen 3.5 percent compared to the same time last year, with bid date delays down 7.8 percent.
The Project Stress Index (PSI) tracks delayed bid dates, on-hold projects and abandonments in preconstruction over the past 30 days, providing an early warning system for market conditions.
Project Stress Index
Source: ConstructConnect, March 2026
Placeholder 'til chart is embedded.
Supply Chain
Analysis
Indices
Forecast
Webinar
Contact
Register for Webinar
Forecasting Local 2026 Construction Costs
This map reflects local USA Building Project Planning Services team leaders’ opinions of market volume and capacity and is not based on published analytics or third-party forecasts.
Click the map pins to see forecast details for a specific city or region.

Miami/Ft. Lauderdale
Seattle
Portland
Orlando
Tampa
New Jersey
New York
Boston
Phoenix
Philadelphia
Washington D.C.
North Carolina/
Virginia
Cincinnati
Atlanta
Nashville
Houston
Dallas
San Antonio
Los Angeles
San Francisco
Boston/New England
The Greater Boston market is seeing moderate growth led by life sciences, healthcare, tech and AI, and public infrastructure, but capital deployment is more cautious. Significant pools of capital remain on the sidelines because of high interest rates, and political discord, nationally and locally, is increasing timing and entitlement risk. We have begun to see projects moving through the local permitting process.
Higher education project activity is muted due to NIH/grant uncertainty and institutions prioritizing deferred maintenance over new builds. Meanwhile, K-12 remains a reliable public pipeline, but some districts face difficulty passing overrides, increasing risk and elongating timelines.
Life sciences are showing early recovery signs, with larger RFPs appearing and competition amongst local firms actively pursuing acquisitions.
Want to discuss Boston's market position and forecast?
Greater Boston Growth Continues as Spending Remains Measured

Back to map

Atlanta, GA
Activity remains elevated but uneven. Mission critical work, particularly data centers, dominates spending while straining electrical and long lead MEP. Healthcare, higher education and mixed-use tied to urban redevelopment and the World Cup are reliable for near-term work. Office construction is limited, and industrial logistics have cooled into a build-to-suit posture.�
Across all sectors, schedule certainty and early decision-making will be the main differentiators as demand remains strong but specialized.
Geopolitical tensions, trade disruptions and evolving tariffs trigger price volatility and extended lead times for electrical gear, generators and imports. AI, cloud infrastructure and data sovereignty investments benefit data center markets like Atlanta, partially offsetting broader caution.��
Stakeholders should plan for cost sensitivity, supply chain risk and selective, but sustained, capital deployment. Owners should advance projects with clearer funding and permitting paths, confirm utility strategies early and remain realistic on MEP pricing. Designers should prioritize procurement-aware design, early trade engagement and flexible phasing.
Data Center and Mission Critical Boom Further Tightens a Strained Labor Force
Want to discuss Atlanta's market position and forecast?
Back to map

Cincinnati, OH
Public infrastructure remains dominant. Initiatives like the Brent Spence Bridge Corridor, Western Hills Viaduct Replacement and ODOT programs generate demand for heavy civil, utility, concrete and structural steel trades.
Data centers account for $10 billion in construction, increasing pressure on labor and material pricing. Both infrastructure and data centers are market disruptors, absorbing resources and commanding premium pricing to meet schedules.
Higher education remains active, with universities investing in STEM,
research and laboratories funded by federal and private partnerships, along with donor-funded athletic facilities. Healthcare is stable, with a focus on maintenance. Health sciences, nursing and allied health facilities grow, while office and lodging struggle due to high vacancies. One notable exception is the Cincinnati Convention Center Headquarters Hotel. Aviation expects $500 million in work over the next few years.
Looking ahead, planned Tri County projects, a new arena and stadium renovations will sustain long-term market strength.�
Infrastructure, Data Centers and Institutional Work Drive Modest Growth
Want to discuss Cincinnati's market position and forecast?

Back to map
Dallas, TX
North Texas Shifts to Strategic, Cluster-Driven Growth �
Want to discuss Dallas's market position and forecast?

Back to map
Washington, D.C.
Public infrastructure is a major driver, with IIJA, CHIPS and IRA federal outlays funding roads, bridges, water, broadband and clean energy. Private commercial development remains challenged, especially office, due to hybrid work and high vacancies. Industrial and data centers, fueled by e-commerce and digital infrastructure, are seeing record expansion. Northern Virginia is the world’s premier data center market, with low vacancy (0.5 percent), multi-GW annual deliveries and multi-billion-dollar hyperscale investments from Amazon, Vantage and CleanArc.
�
Expect labor competition for mission critical trades, tight MEP and electrical workforce capacity, and escalation on power-related scopes. Trade policy, labor shortages and tariff-driven material inflation will intensify cost pressures. Aviation remains strong with projects at BWI Marshall, Reagan National and Dulles International. Planning for the Washington Commanders’ new stadium is underway, with construction beginning in 2027. The surrounding mixed-use development will be the largest economic development project in the city’s history.
Federal Investment Fuels Regional Growth Amid Evolving Market Conditions
Want to discuss Washington D.C.'s market position and forecast?

Back to map
Houston, TX
Houston’s Q2 2026 development market is shifting from headline-driven growth to a more diversified, infrastructure-led cycle. Biotech manufacturing, highlighted by Eli Lilly’s Generation Park project, is catalyzing a second wave of supplier, logistics and lab-enabled industrial development, while the broader industrial pipeline is becoming more selective and build-to-suit focused. Mixed-use activity is increasingly clustering around major public infrastructure investments such as the GRB expansion and Buffalo Bayou East, and downtown is seeing growing adaptive reuse momentum as office repositioning gains traction. At the same time, suburban mixed-use and retail projects are moving faster than urban high-rises, reflecting lower risk, faster absorption and stronger population growth. Overall, Houston is entering a more mature expansion phase, with capital rotating toward specialized products, phased delivery and projects tied closely to long-term infrastructure and life sciences growth.
Houston Market Broadens into a More Diversified Growth Phase
Want to discuss Houston's market position and forecast?
Back to map
Miami/Ft. Lauderdale, FL
Public and institutional work provide the most reliable volume, led by the Miami Airport and Seaport modernization programs, FDOT infrastructure, healthcare and higher education. Meanwhile, the private sector remains dominated by multi-family work, with Southeast Florida leading the nation in units under construction.
Rapid material escalation is back with a combination of sustained national demand from data centers and the recently expanded Section 232 tariffs that heavily impact imported steel and aluminum. As a result, structural steel, rebar and aluminum curtainwall are all experiencing double digit year-over-year increases. This has also compounded the persistent escalation in mechanical and electrical materials, and newer price increases for copper, brass and cast-iron piping.
We suggest reviewing 2025’s budget and lead time expectations for these materials and updating them for 2026 procurement.�
South Florida Market Remains Fundamentally Strong, But Operates Under Pressure
Back to map
Nashville, TN
Middle Tennessee remains active, with momentum in mixed use, condominium and hospitality planning, even as market saturation slows the apartment sector. Multi-family operators are increasingly offering concessions as they compete for renters in a crowded residential landscape. Developers and investors face tighter deal conditions and greater lender scrutiny, creating fluidity in start dates and extending negotiation timelines.
�Redevelopment of Nashville’s East Bank continues to accelerate, supported by large projects, including Oracle's World Headquarters and Fallon Company's mixed-use developments, in planning and early development. Looking ahead, major initiatives such as the New Horizon airport terminal, Korea Zinc's large scale industrial investment and the Vanderbilt Innovation Neighborhood will drive demand and increase the need for skilled labor. Subcontractor and trade partner interest continues to be high, stabilizing pricing across the region.
�Broader economic uncertainty, propelled by geopolitical instability and rising commodity and fuel costs, is adding additional pressure to budgets and long term investment decisions. �
Major Projects Drive Continued Market Activity
Want to discuss Nashville's market position and forecast?
Back to map

North Carolina and Virginia
Across North Carolina and Virginia, sector concentration continues to be a bigger factor than broad market expansion. Labor availability remains constrained, escalating wages and increasing schedule risk. Materials volatility has resurfaced, particularly in metals and long lead electrical and power equipment, while higher interest rates delay or resize privately financed commercial projects.
In North Carolina, market stability is anchored in healthcare, life sciences and advanced manufacturing activity, with support from transportation and public infrastructure. Labor conditions remain comparatively balanced, though growing competition is exerting upward pressure on wages. Outside of these core sectors, higher education, K-12 and commercial development continue to show signs of cooling.
In Virginia, data center and power-related development dominate the market, reinforcing the state’s position as a digital infrastructure hub. This pipeline strains electrical and specialty trades, inflating costs, extending procurement timelines and intensifying labor competition.�
Strained Labor and Long Lead Times are Par for the Course with Market Sector Concentration �
Want to discuss North Carolina and Virginia's market position and forecast?

Back to map
New Jersey
New Jersey began 2026 with momentum, supported by easing material volatility and ongoing workforce constraints. Steel and lumber prices moderated slightly compared to late 2025, while labor costs rose as skilled trade shortages persisted. The New Jersey Alliance for Action forecasts $29.6 billion in annual construction spending, driven utility upgrades, healthcare facilities, transportation infrastructure and enhancements along the Turnpike and Parkway.
�Digital infrastructure remains active but scrutinized. The proposed 2.4 million-SF Vineland AI data center has elevated community concerns around noise, energy demand and water consumption. Similar pressures prompted New Brunswick to eliminate data centers from a planned redevelopment zone.
�Since the January adoption of New Jersey’s REAL Rules, projects face stricter permitting. Elevated flood risk standards, expanded stormwater reviews and rigorous environmental evaluations are reshaping design decisions and feasibility considerations for public and private development.�
Rising Demand, Rising Standards
Want to discuss New Jersey's market position and forecast?
Back to map

New York, NY
New York is active but cost-sensitive, with demand from infrastructure, residential, casinos, healthcare and office-to-residential conversions. The public sector remains a pillar, with MTA and PANYNJ programs like the $10 billion Bus Terminal, 2nd Avenue Subway and Penn Station redevelopment. Higher education is softer than usual, with fewer renovations and delayed starts.
�Over 50 high-rise towers are moving through approvals to active construction, including condominiums, mixed-use, office towers and affordable housing. Manhattan’s share of permitting has declined to 35 percent, while Queens and Brooklyn have surged in mid-rise residential and logistics hubs.
�Overall, the market is entering a new normal of higher costs, labor constraints, permitting delays, and financing sensitivity. Skilled labor availability will continue to pressure schedules and pricing. Material inflation is moderate, but the All-Electric Building Mandate prohibits fossil fuel systems in most new low-rise buildings, shifting demand toward heat pumps and electric infrastructure.
Active Demand, Rising Constraints and the Shift to Electrified Building Systems
Want to discuss New York's market position and forecast?

Back to map
Orlando, FL
Orlando has remained the sixth-fastest-growing large metro area in the nation. Year-over-year employment growth in 2025 was revised up to 0.6 percent, making Orlando the seventh-fastest-growing workforce. These trends created a need for infrastructure investment and for healthcare and education services. This is evident in the fact that these industries represent the largest portion of new jobs in the area.
�Construction job creation has slowed, but the regional market remains very active, with local trade partners finding a tremendous amount of work. Many traditionally “Central Florida only” subcontractors are expanding into Tampa and South Florida. This has increased competition and may be contributing to cooling in cost-driven escalation, which has become the norm.
�Despite the overall positive outlook, there is some anxiety concerning the Middle East conflicts and the ripple effect of increased fuel and material costs, with several manufacturers issuing notices of surcharges passed along to customers.
Population and Job Growth Fuel Needs for Construction �
Back to map
Philadelphia, PA
Surging demand in life sciences, healthcare and higher education is propelling Philadelphia, along with investments in lab space, medical facilities and research-driven campuses. The market is centered on its “eds-and-meds” and innovation economy, with healthcare, life sciences and universities sustaining a steady pipeline as other sectors remain uneven. Growth in life sciences is selective, with emphasis on high-quality lab and research space rather than rapid expansion.
�Healthcare leads all sectors, fueled by outpatient growth, aging demographics and facility modernization, while higher education invests in research infrastructure, student life and innovation districts that reinforce long-term development. Science and technology are increasingly intertwined, boosting demand for specialized R&D, lab and tech-enabled facilities.
�Infrastructure, industrial and logistics development support this core activity, with added momentum from selective mixed-use and residential projects. Meanwhile, traditional office and retail remain subdued.
�Overall, Philadelphia’s 2026 outlook is defined by targeted, institution-driven growth in healthcare, science and education.�
Targeted Growth in Healthcare, Life Sciences and Higher Education �
Want to discuss Philadelphia's market position and forecast?

Back to map
Phoenix, AZ
Phoenix’s semiconductor, data center and advanced tech markets are insulated from the broader cooling in commercial development. The multi-billion dollar TSMC fabs in North Phoenix, Intel’s ongoing fab expansion in Chandler and a wave of hyperscale data center campuses in Mesa, Goodyear and Surprise are driving unprecedented demand for clean room trades, high purity piping, electrical specialists and mission critical commissioning teams. These labor-intensive projects are reshaping regional wage baselines and pulling skilled workers from other sectors, which elevates costs for conventional commercial projects.
�Meanwhile, Arizona’s aggressive incentives for semiconductor and advanced manufacturing investment, paired with federal CHIPS Act funding, attract new entrants, reinforcing a pipeline of megaprojects that will pressure labor availability, utility infrastructure and specialty material supply chains into the next development cycle. Beyond advanced tech, Phoenix projects have felt impacts from shifting demand, elevated interest rates and tariff pressures.�
Phoenix's Mega-Advanced Tech Projects Reshape Labor, Costs and Capacity in the Region
Want to discuss Phoenix's market position and forecast?
Back to map

Portland, OR
The Portland Metro market is stabilizing at a lower overall volume than in recent years, with public sector work—particularly education, healthcare and infrastructure—driving most activity. Cautious private commercial development is leading companies to focus on essential facilities, mission critical upgrades and industrial capacity. Modernization, deferred maintenance and energy efficiency improvements have priority over new build projects.
�The state’s commitment to the Moda Center renovation is a major boost, with more than $365 million in public funding and total costs of $600 million. A key economic anchor, this investment signals long term stability for events and sports while injecting substantial spending into the market and accelerating the redevelopment of the Rose Quarter. The project reinforces the state’s commitment to Portland’s recovery and is expected to stimulate capital flow, generate significant jobs and support community revitalization.
Escalation one to two years from now could be more than 4 percent based on local economic conditions, potential sustained growth in high-tech projects and upcoming union labor rate negotiations.
Portland Metro Market Finds Some Stability through Essential Upgrades and Major Public Commitments �
Want to discuss Portland's market position and forecast?

Back to map
San Antonio, TX
Over the next 12 to 24 months, San Antonio is entering a sustained megaproject cycle that will overlap sports, civic, aviation, transportation, mission critical and private development work, keeping backlogs strong but increasing execution complexity.
For owners, early partner engagement and realistic escalation planning are essential; for GCs, trade relationships and workforce planning are key differentiators; and for subcontractors, pricing power increasingly comes with tighter schedule obligations.
Overall, the market is not overheated—but it is meaningfully capacity constrained, making early planning and risk management critical to successful project delivery. �
Large Projects Drive Capacity Constraints
Want to discuss San Antonio's market position and forecast?

Back to map
San Francisco, CA
Construction in the San Francisco Bay Area remains strong in select markets, supported by sustained volume in healthcare, life sciences, public infrastructure and data center development. Seismic compliance mandates, institutional capital programs and AI demand are driving advancement in these sectors despite broader economic uncertainty. Conversely, speculative office development remains largely on pause, with activity concentrated in tenant improvements and phased mixed use districts.
Although the cost pressures of previous years have eased somewhat, escalation risk persists for MEP systems, power related equipment and specialized labor. Labor availability is currently stable but is tightening for healthcare, data center and infrastructure projects. Near term success will be driven by execution discipline, early collaboration and conservative forecasting, rather than growth-motivated risk taking. �
A Select Few Sectors Dominate the Bay Area Market
Back to map
Seattle, WA
Seattle’s construction market in Q2 2026 shows a clear divide between public and private activity. Private development remains muted as high borrowing costs, tighter lending, and elevated vacancy rates limit new office and multifamily starts. By contrast, public agencies are advancing long-term capital programs that stabilize construction volume.�
The public-sector momentum is led by K–12, maintenance and operations, and higher education projects supported by voter-approved funding and state energy initiatives. The Port of Seattle and King County continue major transportation programs. Healthcare is gaining traction, with providers advancing capital projects into preconstruction.
Contractors face intense bid competition alongside material and labor pressures. Overall costs are stable, but wage growth continues as firms retain skilled labor. Supply chain constraints affect metals and mechanical and electrical equipment, driven by infrastructure work, while fuel prices increase transportation costs.
Building Through Uncertainty
Want to discuss Seattle's market position and forecast?
Back to map
Tampa, FL
In 2026, the Tampa construction market has shifted from the record-setting pace of 2024 to a more stable, sustainable growth cycle. Current activity is concentrated in resilient, high-growth sectors such as healthcare, education and mission-critical data centers, with major investments including the Moffitt Cancer Center expansion and Plant City Technical College.
�This stabilization, however, comes with persistent regional pressures. Florida remains one of the most labor-constrained states, with an estimated shortfall of 500,000 workers in 2026. At the same time, MEP trades and specialized materials are experiencing cost escalation that often exceeds national averages.
�To navigate these conditions, project teams should prioritize early engagement with key trades, proactively manage material volatility through early procurement and rely on comprehensive cost modeling that accurately reflects MEP-driven escalation throughout the project lifecycle.�
Despite Labor Constraints, Trade Partner Participation Increases �
Want to discuss Tampa's market position and forecast?
Back to map

Design Sentiment
Don’t miss the new design sentiment section to see what our leaders had to say about the industry’s top concerns.
Want to discuss Orlando's market position and forecast?


Want to discuss South Florida's market position and forecast?

See a summary of our market sector performance and local escalation forecast below.
Market Sector Overview
Back to map
Local Escalation Summary
Back to map
Significantly busy - price inflation, +6% per annum
Busy - price inflation is above normal, 4 - 6% per annum
Stable - price inflation is within traditional indices, less than 4% per annum
Recessed - price inflation is flat or negative
Market sector is very busy with many large active projects either in preconstruction or construction
Market sector is stable with some large active projects either in preconstruction or construction
Market sector is slow with few large active projects either in preconstruction or construction
Skanska is not tracking this sector closely enough in our regional market to comment
Market sector summary
Local escalation summary
Next Page
Previous Page
Local Construction Cost Forecast
Next 6 months
6 months - 1 year
1 - 2 years
Status Key
Trending Up Significantly
Trending Up
Trending Down
Stable/Consistent
Local Construction Cost Forecast
Next 6 months
6 months - 1 year
1 - 2 years
Local Construction Cost Forecast
Next 6 months
6 months - 1 year
1 - 2 years
Status Key
Trending Up Significantly
Trending Up
Trending Down
Stable/Consistent
+6% per annum
4-6% per annum
<4% per annum
Market is recessed
Status Key
Trending Up Significantly
+6% per annum
<4% per annum
Market is recessed
4-6% per annum
Trending Up
Trending Down
Stable/Consistent
Want to discuss San Francisco's market position and forecast?

Science+ Technology
Transportation
Manufacturing
Aviation
Corporate Commerical
Data Centers
Distribution/
Warehouse
Healthcare
Higher Education
K-12 Education
North Texas enters Q2 in a more strategic phase of growth, with capital concentrated in the market’s strongest clusters rather than spread across the metro. Industrial remains a major engine, but the focus is shifting from speculative supply to tenant-driven, specialized projects in North Dallas Area, Southern Dallas and Collin County. Corporate relocation momentum continues to strengthen suburban hubs such as Plano and Frisco, reinforcing the rise of large-scale “mega-nodes” around Legacy and the broader Frisco-Prosper-McKinney corridor.
�Repositioning is increasingly defining office market conditions, with demand centered on Class A and amenitized space. Meanwhile, older assets face growing pressure for adaptive reuse or reinvestment. Multi-family is stabilizing after heavy supply delivery, though select submarkets face elevated concessions. Retail remains strong, supported by low vacancies, rising rents and expanding grocery-anchored and experiential formats. Overall, Q2 confirms that Dallas-Fort Worth is moving from rapid expansion to more disciplined, cluster-based development.
Jeff Courtney
Preconstruction Manager

Mandy Weitknecht
Senior Vice President, Business Development
Tampa, FL
Concerns remain in the region around tariffs, immigration and other federal policies. The potential for changes to immigration policy could reduce the labor pool, increasing demand and labor costs, and tariffs continue to create uncertainty. However, none of these concerns have yet materialized in increased project costs. Despite this, our trade partners have reserved their right to increase costs if they become impacted by tariffs.
�Single and multifamily housing construction demand hasn’t lessened and continues to put pressure on an already strained skilled labor market. Supply chains, costs and lead times have stabilized. We continue to see an increase in trade partners willing to bid, especially on healthcare, K–12 and higher education projects. This is a positive sign, indicating ongoing market activity. While we seek new opportunities in other sectors, we continue to see a steady release of government projects.
Trade Partner Participation Increases and Skilled Labor Shortage Continues
Want to discuss Tampa's market position and forecast?
Jeff Courtney
Preconstruction Manager
Mandy Weitknecht
Senior Vice President, Business Development
Back to map
Local Construction Cost Forecast
Next 6 months
6 months - 1 year
1 - 2 years
Status Key
Trending Up Significantly
+6% per annum
<4% per annum
Market is recessed
4-6% per annum
Trending Up
Trending Down
Stable/Consistent
Local Construction Cost Forecast
Next 6 months
6 months - 1 year
1 - 2 years
Status Key
Trending Up Significantly
+6% per annum
<4% per annum
Market is recessed
4-6% per annum
Trending Up
Trending Down
Stable/Consistent
Local Construction Cost Forecast
Next 6 months
6 months - 1 year
1 - 2 years
Status Key
Trending Up Significantly
+6% per annum
<4% per annum
Market is recessed
4-6% per annum
Trending Up
Trending Down
Stable/Consistent
Local Construction Cost Forecast
Next 6 months
6 months - 1 year
1 - 2 years
Status Key
Trending Up Significantly
+6% per annum
<4% per annum
Market is recessed
4-6% per annum
Trending Up
Trending Down
Stable/Consistent
Local Construction Cost Forecast
Next 6 months
6 months - 1 year
1 - 2 years
Status Key
Trending Up Significantly
+6% per annum
<4% per annum
Market is recessed
4-6% per annum
Trending Up
Trending Down
Stable/Consistent
Local Construction Cost Forecast
Next 6 months
6 months - 1 year
1 - 2 years
Status Key
Trending Up Significantly
+6% per annum
<4% per annum
Market is recessed
4-6% per annum
Trending Up
Trending Down
Stable/Consistent
Local Construction Cost Forecast
Next 6 months
6 months - 1 year
1 - 2 years
Status Key
Trending Up Significantly
+6% per annum
<4% per annum
Market is recessed
4-6% per annum
Trending Up
Trending Down
Stable/Consistent
Local Construction Cost Forecast
Next 6 months
6 months - 1 year
1 - 2 years
Status Key
Trending Up Significantly
+6% per annum
<4% per annum
Market is recessed
4-6% per annum
Trending Up
Trending Down
Stable/Consistent
Local Construction Cost Forecast
Next 6 months
6 months - 1 year
1 - 2 years
Status Key
Trending Up Significantly
+6% per annum
<4% per annum
Market is recessed
4-6% per annum
Trending Up
Trending Down
Stable/Consistent
Local Construction Cost Forecast
Next 6 months
6 months - 1 year
1 - 2 years
Status Key
Trending Up Significantly
+6% per annum
<4% per annum
Market is recessed
4-6% per annum
Trending Up
Trending Down
Stable/Consistent
Local Construction Cost Forecast
Next 6 months
6 months - 1 year
1 - 2 years
Status Key
Trending Up Significantly
+6% per annum
<4% per annum
Market is recessed
4-6% per annum
Trending Up
Trending Down
Stable/Consistent
Local Construction Cost Forecast
Next 6 months
6 months - 1 year
1 - 2 years
Status Key
Trending Up Significantly
+6% per annum
<4% per annum
Market is recessed
4-6% per annum
Trending Up
Trending Down
Stable/Consistent
Local Construction Cost Forecast
Next 6 months
6 months - 1 year
1 - 2 years
Status Key
Trending Up Significantly
+6% per annum
<4% per annum
Market is recessed
4-6% per annum
Trending Up
Trending Down
Stable/Consistent
Local Construction Cost Forecast
Next 6 months
6 months - 1 year
1 - 2 years
Status Key
Trending Up Significantly
+6% per annum
<4% per annum
Market is recessed
4-6% per annum
Trending Up
Trending Down
Stable/Consistent
Local Construction Cost Forecast
Next 6 months
6 months - 1 year
1 - 2 years
Status Key
Trending Up Significantly
+6% per annum
<4% per annum
Market is recessed
4-6% per annum
Trending Up
Trending Down
Stable/Consistent
Local Construction Cost Forecast
Next 6 months
6 months - 1 year
1 - 2 years
Status Key
Trending Up Significantly
+6% per annum
<4% per annum
Market is recessed
4-6% per annum
Trending Up
Trending Down
Stable/Consistent
Local Construction Cost Forecast
Next 6 months
6 months - 1 year
1 - 2 years
Status Key
Trending Up Significantly
+6% per annum
<4% per annum
Market is recessed
4-6% per annum
Trending Up
Trending Down
Stable/Consistent
Local Construction Cost Forecast
Next 6 months
6 months - 1 year
1 - 2 years
Status Key
Trending Up Significantly
+6% per annum
<4% per annum
Market is recessed
4-6% per annum
Trending Up
Trending Down
Stable/Consistent
Dan Curtiss
Vice President of Preconstruction
Ivi Gabales
Business Development Strategist

Raki Chaitt
Preconstruction Director
Chris Hillyer
Senior Vice President of Preconstruction
Matt Richardson
Vice President of Preconstruction
Jeff Smoker
Senior Vice President of Preconstruction
James Lane
Vice President of Preconstruction
Tom Stickrod
Vice President of Preconstruction
Pratod Padalkar
Vice President of Preconstruction
Nick Culver
Vice President of Preconstruction
Chris Littlefield
Vice President of Preconstruction
Adam Hicks
Vice President of Preconstruction
Walt Chislak
Preconstruction Manager
Linh Le
Vice President of Preconstruction
Tom Strawbridge Preconstruction Director
Linh Le
Vice President of Preconstruction
Shannan Plogsted
Vice President of Preconstruction
Matt Impastato
Vice President of Preconstruction
Dane Wooley
Preconstruction Director

Laura Hawley
Vice President, Business Development

Steve Lyons
Vice President, Business Development

Debbie Hutchins
Vice President, Business Development

Erika Pham
Vice President, Business Development

Michelle Santoro
Senior Director, Business Development

Jan-Erik Hustrulid
Business Development Director

Sara Francini
Senior Vice President, Business Development

Tracy Anderson
Senior Director, Business Development

Bob Myer
Senior Vice President, Business Development

Bryan Hay
Vice President, Business Development
Mandy Weitknecht
Senior Vice President, Business Development

Mandy Weitknecht
Senior Vice President, Business Development

Jackie Ryan
Business Development Director

Kimberly Burke
Senior Vice President, Business Development

Brian Bozeman
Senior Vice President, Business Development

Joe Devlin
Senior Vice President, Business Development

Veronica Gross
Vice President, Business Development
Hunter Curry
Business Development Manager

Market Condition and Construction Price Inflation
1+ year
6 months - 1 year
Next 6 months
MA
AZ
CA
SF
DC
FL
MIA
FL
ORL
FL
TPA
GA
NC/VA
NJ
TX
SAT
TX
HOU
TX
DFW
TN
PA
OR
OH
NY
WA
MA
AZ
CA, SF
DC
FL, MIA
FL, ORL
FL, TPA
GA
NC/VA
NJ
TX, SAT
TX, HOU
TX , DFW
TN
PA
OR
OH
NY
WA
Market Sector Condition
Supply Chain
Analysis
Indices
Forecast
Webinar
Contact
Register for Webinar
West
South
East
West
South
East


